Smart Pricing Strategies for Wyckoff NJ Home Selling
Pricing your Wyckoff home even a little too high can stall showings and cost you time and money. Getting it right from day one is how you spark interest, control the timeline, and protect your net. If you want a clear, data-backed plan, you’re in the right place. You’ll learn how Wyckoff’s market is trending, what drives value street by street, and a simple method to set a confident list price that attracts the right buyers. Let’s dive in.
Wyckoff sits at the higher end of Bergen County pricing. Zillow’s town-level Home Value Index shows a typical value of about $1,091,109 with an 8.5% year-over-year increase as of January 2026. Redfin’s Wyckoff snapshot often shows a higher median sale price around the low-to-mid $1.3 millions, with a town-level anchor near $400 per square foot. These portals use different data and methods, so treat them as a range, not a single number.
Bergen County’s broader market cooled from its 2025 peak. County-level medians near the low $700,000s and longer days-on-market suggest buyers are more selective. Even so, correctly priced homes across Bergen still tend to sell at or slightly above list. In Wyckoff, that usually means a strong launch with an accurate, well-supported price.
Wyckoff operates K–8 schools in the Wyckoff School District. High school students attend Ramapo Indian Hills Regional High School District. Many buyers review public sources when evaluating schools. Academic research shows that school quality is often reflected in home values, though the size of that premium varies by market and by school catchment. You can review an academic summary on school quality and pricing in this literature review.
If schools are part of your buyer’s decision, encourage them to review public resources such as GreatSchools’ Wyckoff pages and to verify current attendance boundaries with the district. Keep your language neutral and factual when describing schools.
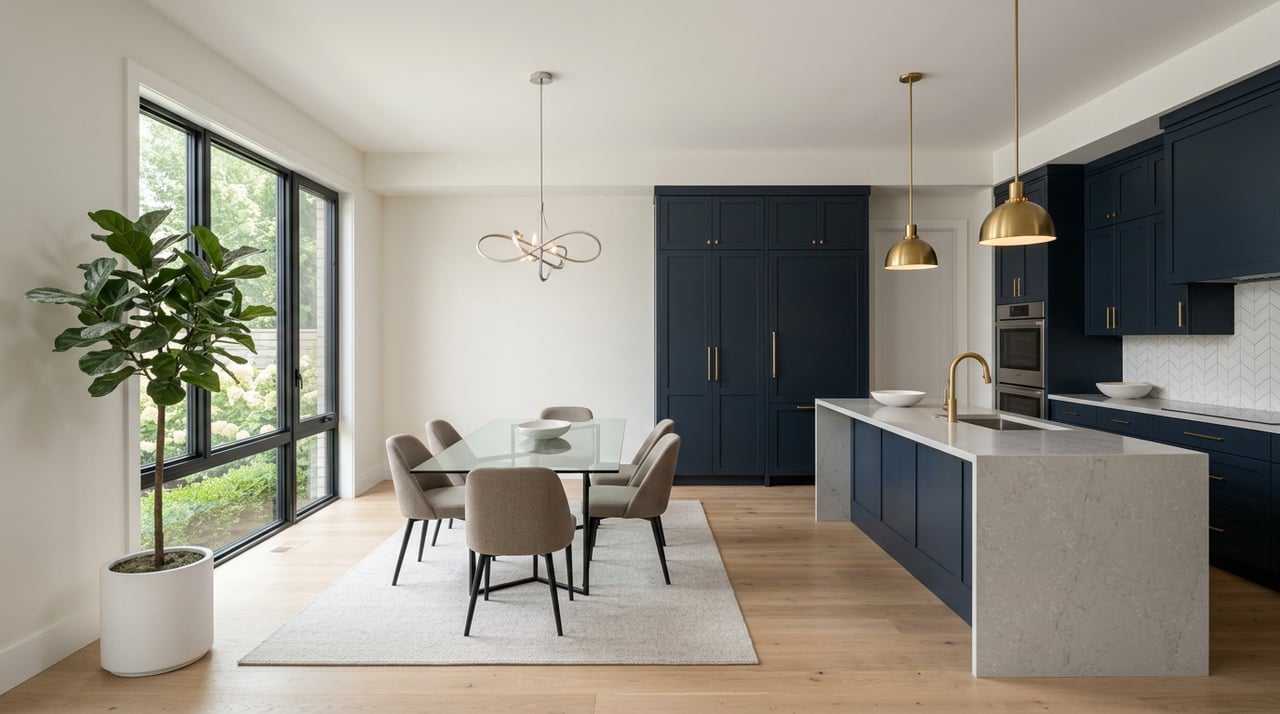
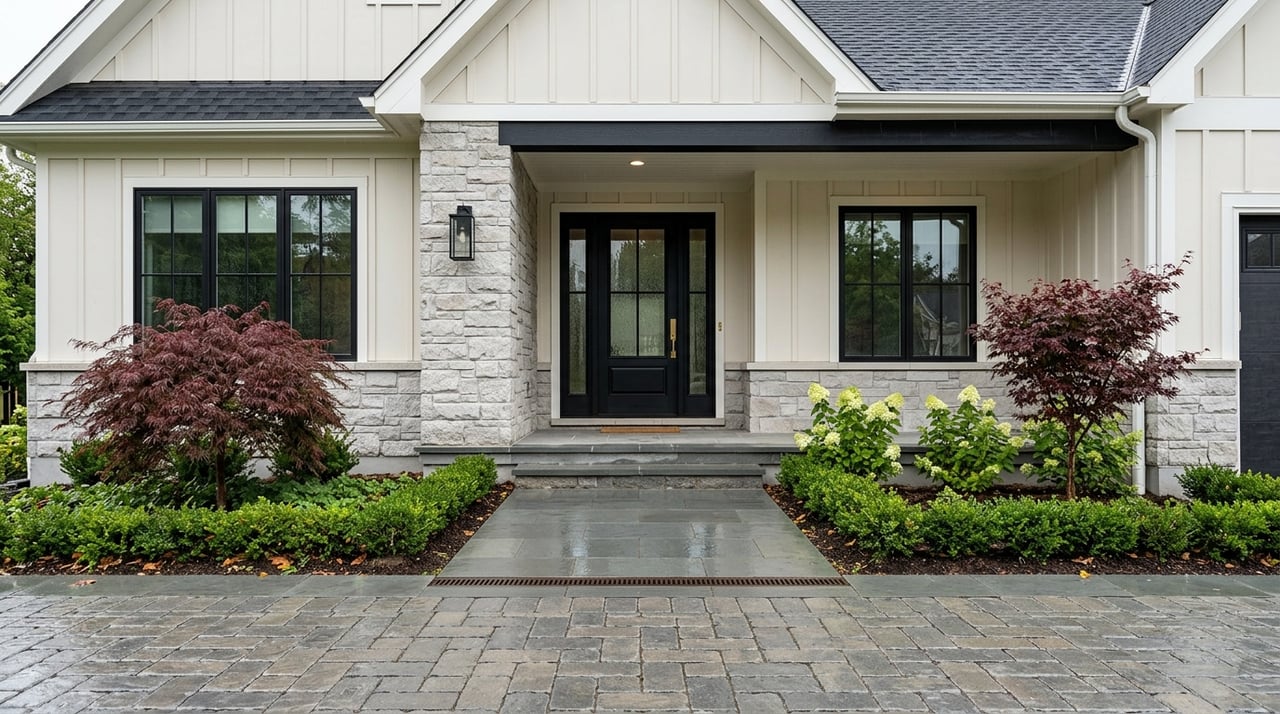
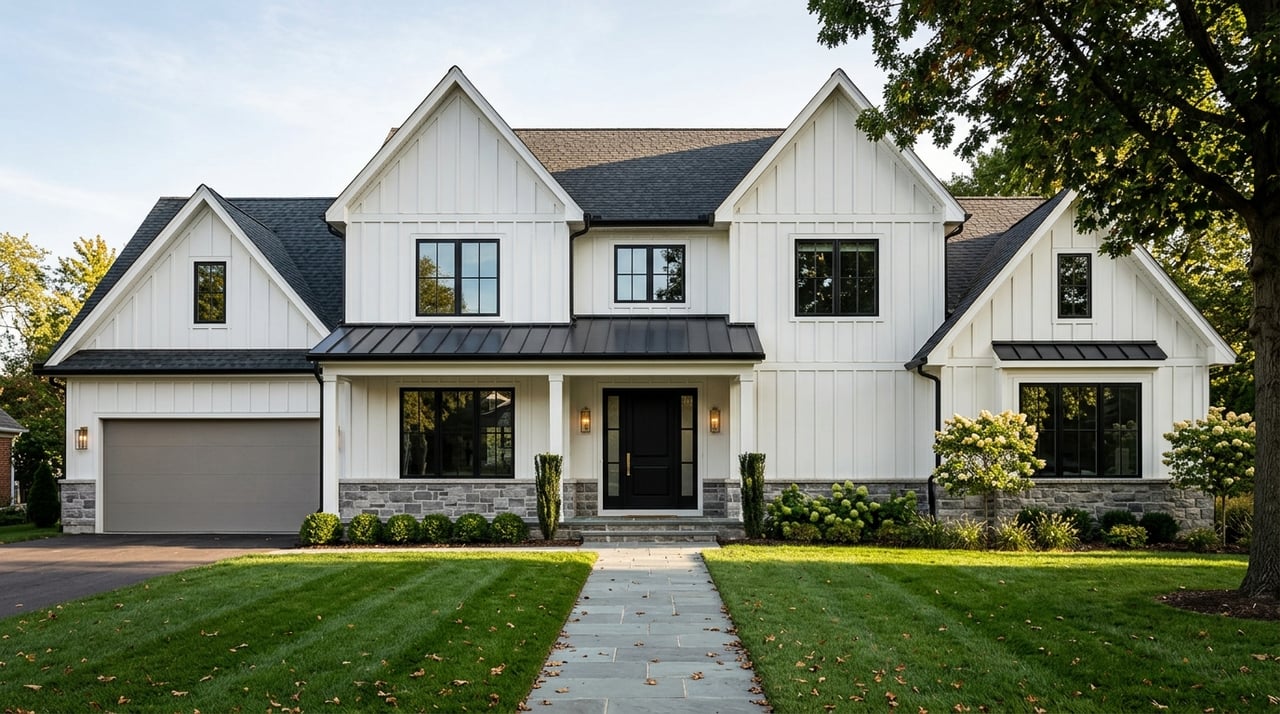
Wyckoff does not follow rigid subdivisions, but micro-locations matter. Areas like Sicomac, sections of West Wyckoff with larger lots, and streets near Franklin Avenue can command different price points due to lot size, updates, and proximity to town amenities. Two homes with the same square footage can value very differently based on block, privacy, condition, and land.
Bergen County property taxes are above national averages. Local reporting shows Wyckoff’s typical bills trend higher than many U.S. towns. Review county-by-town data to understand buyer affordability and your own net proceeds. A helpful roundup is available via MyBergen’s property tax list. Always confirm your specific tax record before listing.
Buyers in Wyckoff often value a balanced suburban lifestyle: access to NYC transportation options in the region, local parks, and a polished town center. Regional lifestyle overviews, like this Bergen County summary, can help relocating buyers frame the tradeoffs. In practice, homes that pair strong schools, a manageable commute option, and usable outdoor space tend to see deeper demand.
The best pricing method is structured and evidence-based. It mirrors how an appraiser or top agent builds a market-supported opinion of value.
Focus as locally as possible. Start with the same street or immediate block. If you must expand, use the closest micro-neighborhood or the same school catchment. The Appraisal Institute’s professional guidance echoes the importance of tight geographic and buyer relevance.
Aim for 3 to 6 closed sales that match your home’s key traits. In fast markets, prioritize sales within the last 3 months. If inventory is thin, you can reach back 6 to 12 months, but you may need time adjustments. Document your selection logic and dates.
If a comp sold several months ago and the market has moved, apply a time adjustment and note your basis. State appraisal materials explain that time adjustments should be supported and clearly documented. You can review a primer on time adjustments in this state appraisal resource.
Narrow your range to a low, mid, and high figure with tradeoffs. For example, if the town-level anchor is about $400 per square foot, a 2,500 square foot home implies around $1,000,000 before adjustments. From there, adjust up or down for condition, land, privacy, and features to reach a supported list-price band. Present that band and explain how speed, certainty, and exposure period change at each point.
Check your price band against the competition. Where do active listings with similar specs sit, and how long have they been on the market? Are there pending sales near your target number? The first 1 to 3 weeks after launch are your golden window. If showings and offers do not match expectations, revisit price and presentation quickly.
For most sellers, a market-accurate list price paired with strong marketing and condition yields the best net. County-level data shows that correctly priced homes often sell at or slightly above list. You focus inquiries during peak launch exposure without triggering buyer skepticism.
In a low-inventory pocket with strong demand, listing 1 to 3 percent under your supported number can encourage broader traffic and potential competition. The risk is real: if your home is not move-in ready or misses a key buyer preference, underpricing may not create a bidding scenario. Use this tactic when your comps, prep, and marketing are tight.
Starting high can feel safe, but it often backfires. Overpriced homes draw fewer showings, chase the market through price reductions, and can net less than a right-priced launch. If you test the top of your range, commit to a short review cadence and follow the data.
Start with safety and big systems, then move to high-impact, cost-effective updates. A presale inspection can help you prioritize and avoid late surprises. Professional resources encourage clear documentation and planning, as reflected in Appraisal Institute guidance.
High-return projects often include:
External cost-versus-value research shows that targeted projects tend to recapture more than large overhauls. The annual Cost vs. Value report highlights strong recapture for items like garage door and entry door replacements, and solid returns for minor kitchen refreshes in many regions. Review the latest figures for your planning at Cost vs. Value.
Understanding typical seller costs helps you make better pricing decisions. National guides suggest that total commissions have historically ranged around 5 to 6 percent, and closing costs often add 1 to 3 percent depending on state and local items. A plain-English overview is available from Bankrate’s seller closing cost guide. Ask your agent for a customized net sheet based on your target price and Wyckoff-specific fees.
Common negotiation levers to discuss with your agent and attorney include:
This rhythm keeps you inside the market’s attention window and protects your leverage.
If you want a supported number and a plan to achieve it, partner with a team that lives in this data every day. We’ll build a pinpoint CMA, lay out your prep roadmap, and execute a launch that attracts the right buyers fast. Speak with Roi Klipper for a custom Wyckoff pricing strategy and seller net analysis.
Stay up to date on the latest real estate trends.


Start your journey towards your dream home today! Subscribe now for exclusive access to expert insights, insider tips, and the latest property listings. Don't miss out on the opportunity to make informed real estate decisions. Subscribe to our newsletter now!